

The raw numbers say a lot about employment, labor, wages, hiring, and workforce attrition in the hospitality industry and in the economy at large
As Neil DeGrasse Tyson once said, [science is]true whether or not you believe in it.” So, too, is the raw data that’s being tracked by the U.S. Bureau of Labor Statistics with regard to employment, the economy at large, and the hospitality industry specifically. The data being compiled is right there in black and white, unrelenting and immovable. And in a time of particularly polarizing personal politics, contentious clashes across the country, and mass-media misinformation, it should be reassuring to know there are more ways than ever for the average hotelier to obtain unfiltered industry data. To be sure, the AAHOA-commissioned Oxford Economics Study contains a wealth of association-specific data that speaks to the power of AAHOA Members. But having a check of the industry’s pulse, not to mention a closer parsing of the of the overall economy, is vital when making future plans and implementing existing strategies.
The rabbit hole of data goes deeper each year, especially with the proliferation of data-tracking services. So, before you start digging on your own, here are several key metrics that help paint a picture of where the economy, along with hotels, has been for the past five years, and the insight may help predict where it’s headed. Grab a snack, get comfortable, and let’s dig in.
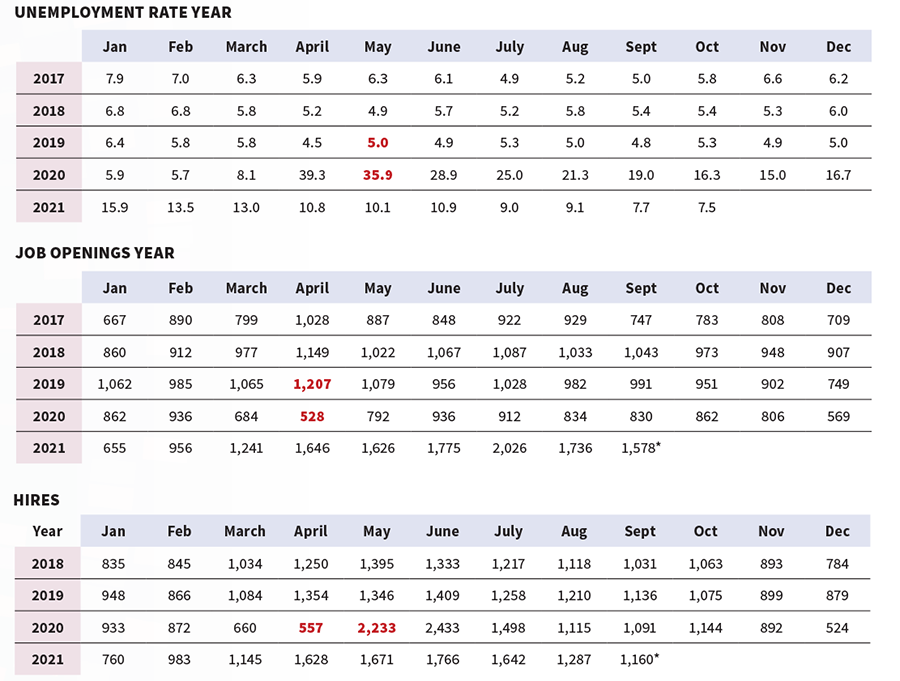
Workforce statistics
This section provides information relating to employment and unemployment in leisure and hospitality. While most data are obtained from employer or establishment surveys, information on industry unemployment comes from a national survey of households. The following tables present an overview of the industry, including the number of jobs, the unemployment rate of those previously employed in the industry, job openings and labor turnover, union membership and representation, gross job gains and losses, and projections of occupational employment change. This section includes employees in the following sectors: arts, entertainment, recreation, accommodation, and food services.
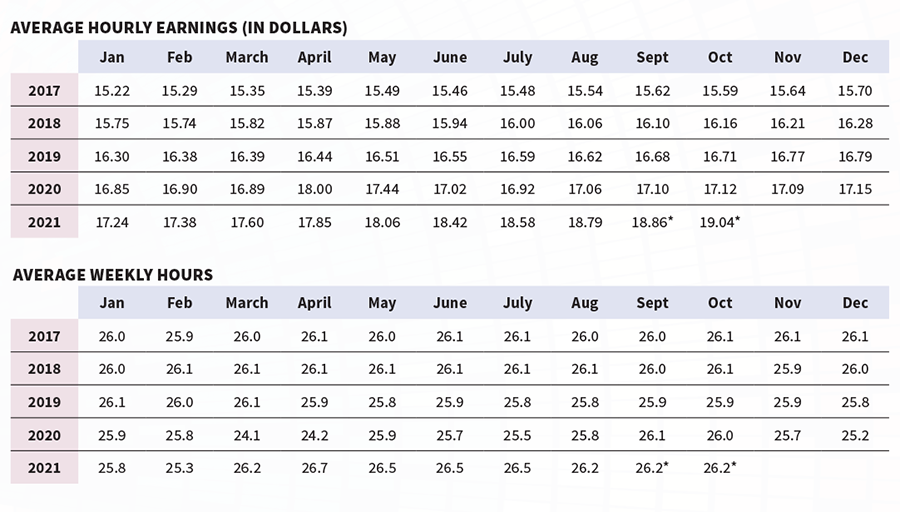
Earnings and hours
This section presents data on employee earnings and weekly hours. The latest industry averages of hourly earnings and weekly hours, as well as weekly earnings by union membership status, are shown. This section also contains information on the average cost of benefits paid by employers, as well as recent rates of change in wages and total compensation. This section includes employees in the following sectors: arts, entertainment, recreation, accommodation, and food services.
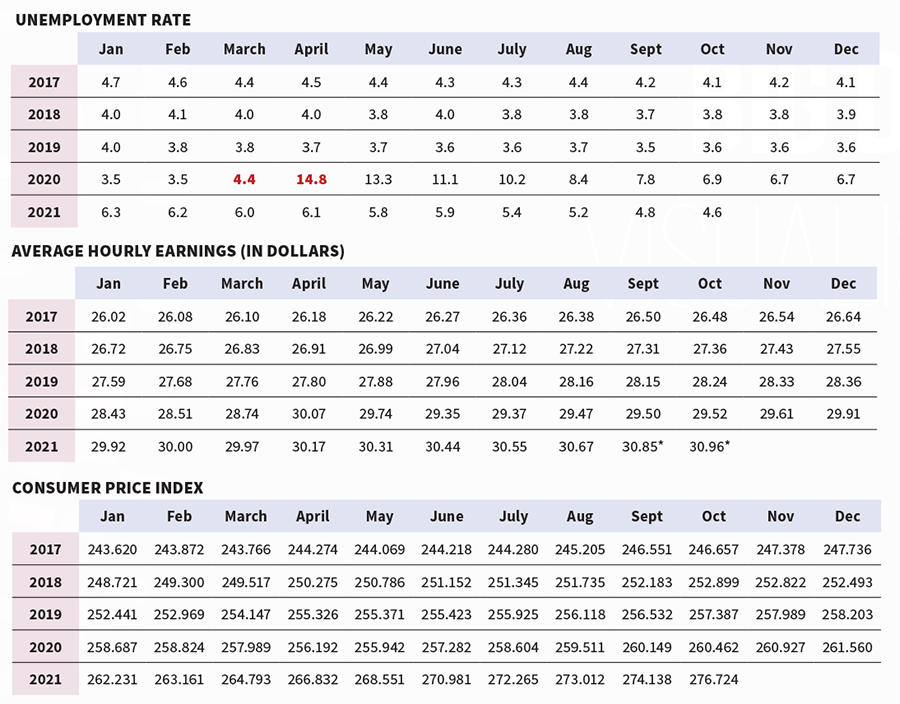
United States monthly data
This section provides information relating to employment, hourly earnings, and the consumer price index across the whole of the American workforce.
∗ Preliminary data
Source: U.S. Bureau of Labor Statistics (www.bls.gov)
Data retrieved: 12/2/2021


